EMF HARMONY Research and technology
RESEARCH ON EMF HARMONY TECHNOLOGY
Positive physiological effects of the EMF Harmony technology have been demonstrated in a number of studies using various measurement devices where health parameters of test subjects are measured before and after exposure to EMF radiation with and without protection from EMF Harmony devices. Following are examples of such studies & tests:
- Heart Rate Variability Study
- Cress Sprouts Growth Test
- EMF Protection Case Study
- Live Blood Analysis Study
- Gas Discharge Visualization Test
- Heart Rate Variability Test
HEART RATE VARIABILITY STUDY
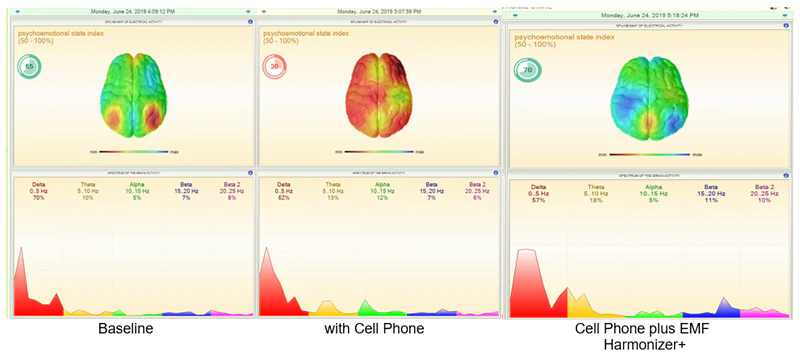
The figure below shows measurements taken with a HeartQuest heart rate variability (HRV) device. On the left are baseline readings from a test subject, in the middle are results after a 5 minute unprotected cell phone call, and on the right are results after a 5 minute cell phone call with the EMF Harmonizer+ attached to the phone. The top figures show the test subject’s psycho-emotional state index, which dropped from the baseline 65% to 30% after the unprotected cell phone call, and increased to 70% after using the cell phone with the Harmonizer+ attached (better than baseline). The bottom figures show the subject’s brainwave measures for delta, theta, alpha, beta and gamma rhythms. Click here to view the complete study.
CRESS SPROUTS GROWTH TEST
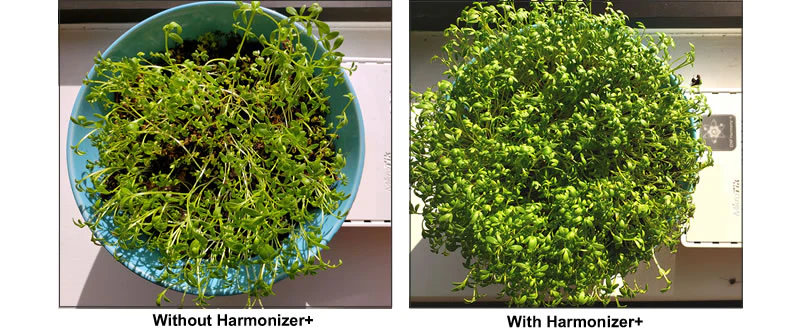
This test provides a visual demonstration of the negative effects of EMF radiation on the growth of cress sprouts, and how the EMF Harmonizer+ minimized these negative effects. The test includes sprouts grown next to a WiFi router emitting measurable EMF radiation, and a control group of sprouts grown 8 feet away with no exposure to EMF radiation. On the left is a picture of the sprouts grown next to the router without EMF protection, and on the right are the sprouts grown with the Harmonizer+ on the router. Click here to view the complete study, including pictures of the sprouts under various growing conditions. Or click here to view the video overview.
EMF PROTECTION CASE STUDY

In this case study a middle aged couple exposed to EMF radiation throughout their lives were tested before and after being provided with EMF Harmony products for their devices and home. Their EMF stressors included frequent use of cell phones, laptops, iPads; a “smart house” full of wireless networks, appliances, gadgets; one electric and one hybrid car; and solar panels on the home with a converter. The testing included a thorough physical/neurological/functional exam and comprehensive blood panel. The notable improvements in their health are detailed in the report. Click here to view the complete study.
LIVE BLOOD ANALYSIS STUDY
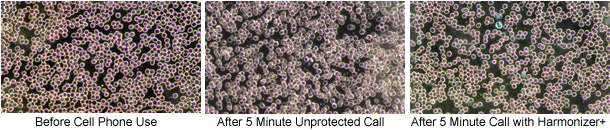
The images below are blood samples from a test subject magnified using a dark field microscope. The image on the left shows a sample taken before using a cell phone, and the red blood cells are spaced apart and moving freely in a healthy state. The middle image shows a sample taken after a 5 minute unprotected cell phone call, and the red blood cells are clumping and aggregating in an unhealthy state. The image on the right shows a sample taken after a 5 minute cell phone call using the EMF Harmonizer+, and the red blood cells are again moving freely in a healthy state. Click here to view the complete study.
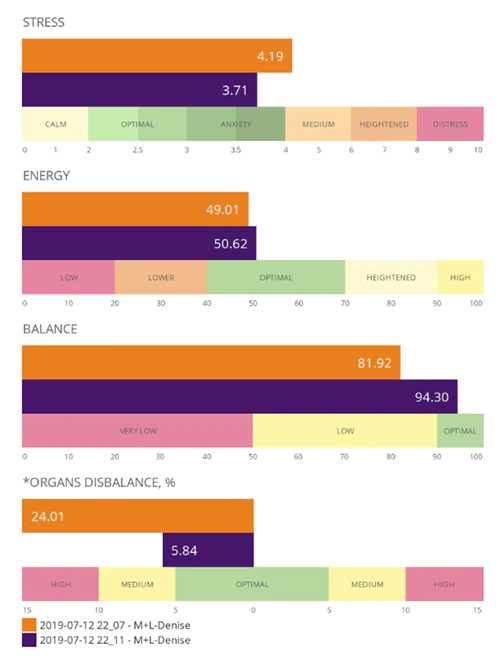
GAS DISCHARGE VISUALIZATION TEST
The graphs below are the results of a gas discharge visualization (GDV) test on a healthy subject, with the orange representing the default state of the subject and the violet representing the state of the subject after wearing the EMF Harmony Mobility+ bracelet for 4 minutes. Significant improvements are shown in all areas, most notably reduced stress, increased energy, and better organ balance. Click here to view the complete report.
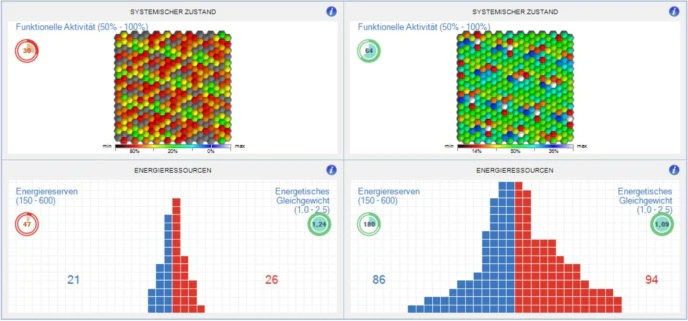
HEART RATE VARIABILITY TEST
The figure below shows measurements taken with a Nilas MV heart rate variability (HRV) device. On the left are readings after a 5 minute unprotected cell phone call, and on the right are readings after a 5 minute cell phone call with the EMF Harmonizer+. The top figures show the test subject’s central neuro hormonal system regulation, which improved from a measurement of 30 to 64. The bottom figures show the subject’s energy reserves and utilization, with the blue squares indicating anabolic and the red catabolic processes. These results improved from a measurement of 21 / 26 to 86 / 94 when using the Harmonizer+. Click here to view the complete report.